
As industrial processes become more complex, the importance of collecting, analyzing, and acting on data grows. The challenge of collecting and using factory-floor data effectively is compounded by the sheer volume of data generated.
In this article, we will show you how to move data from multiple sources to the cloud in under 2 minutes using the Omron DX1 Data Flow Controller.
Together with its built-in supporting software engine, the DX1 is capable of using the Real Time Streaming Protocol (RTSP) for data collection.
Capturing the data is accomplished by a simple camera drag-and-drop operation.
We’re going to introduce you to the Omron DX1 Data Flow Controller and its browser-based data-collection and data-utilization software engine, SpeeDBee Synapse.
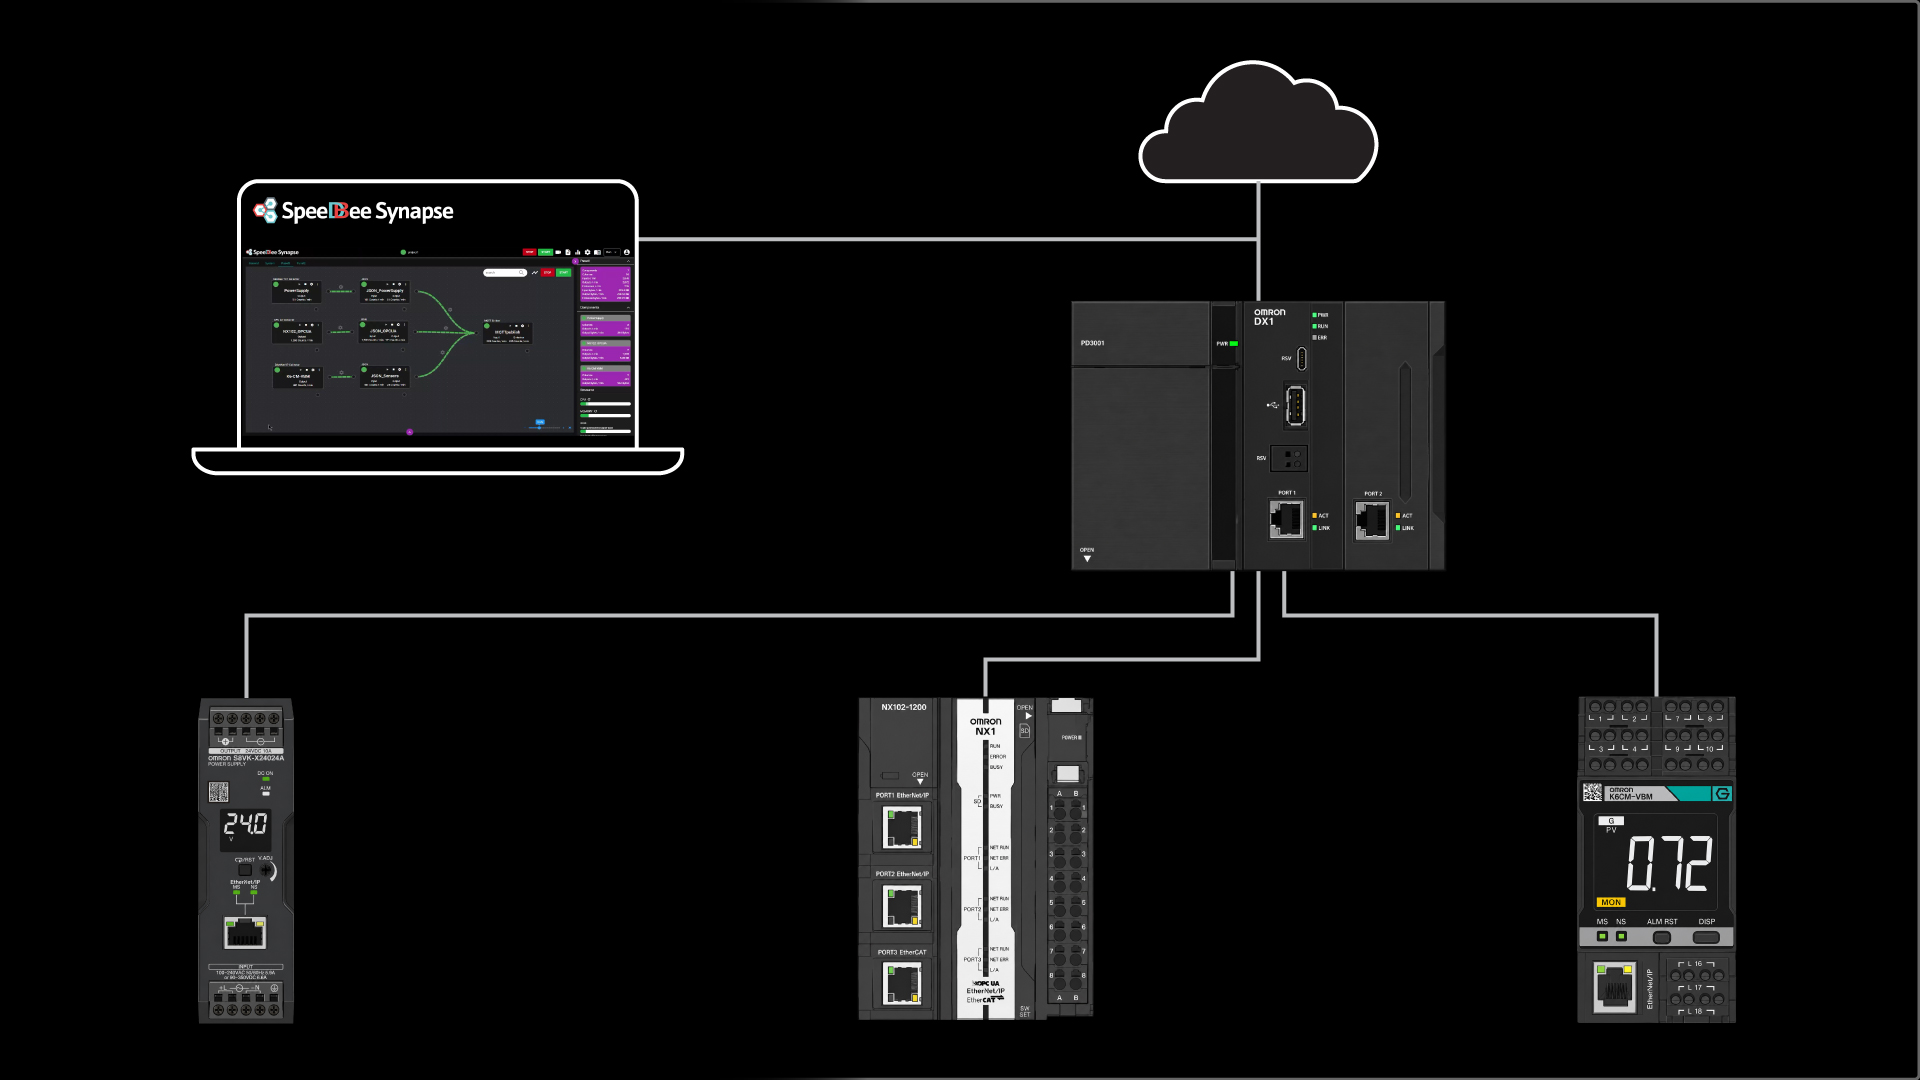
The article will culminate in a practical demonstration of a DX1 Flow Controller connected to multiple devices that collect motor temperature, torque and vibration data, as well as power supply current and voltage parameters.
This demo will use the built-in SpeeDBee Synapse flow editor, which lets users visually build an industrial data pipeline by dragging and connecting modular components.
We’ll show you how the SpeedDBee synapse workflow editor serializes this data and, in this case, sends it via an MQTT emitter to a Broker. The project highlights built-in visualization by incorporating a local Grafana dashboard for real-time site analysis.
Omron DX1 Data Flow Controller
But first, let’s start with a quick overview of the key features of the DX1 Data Flow Controller.
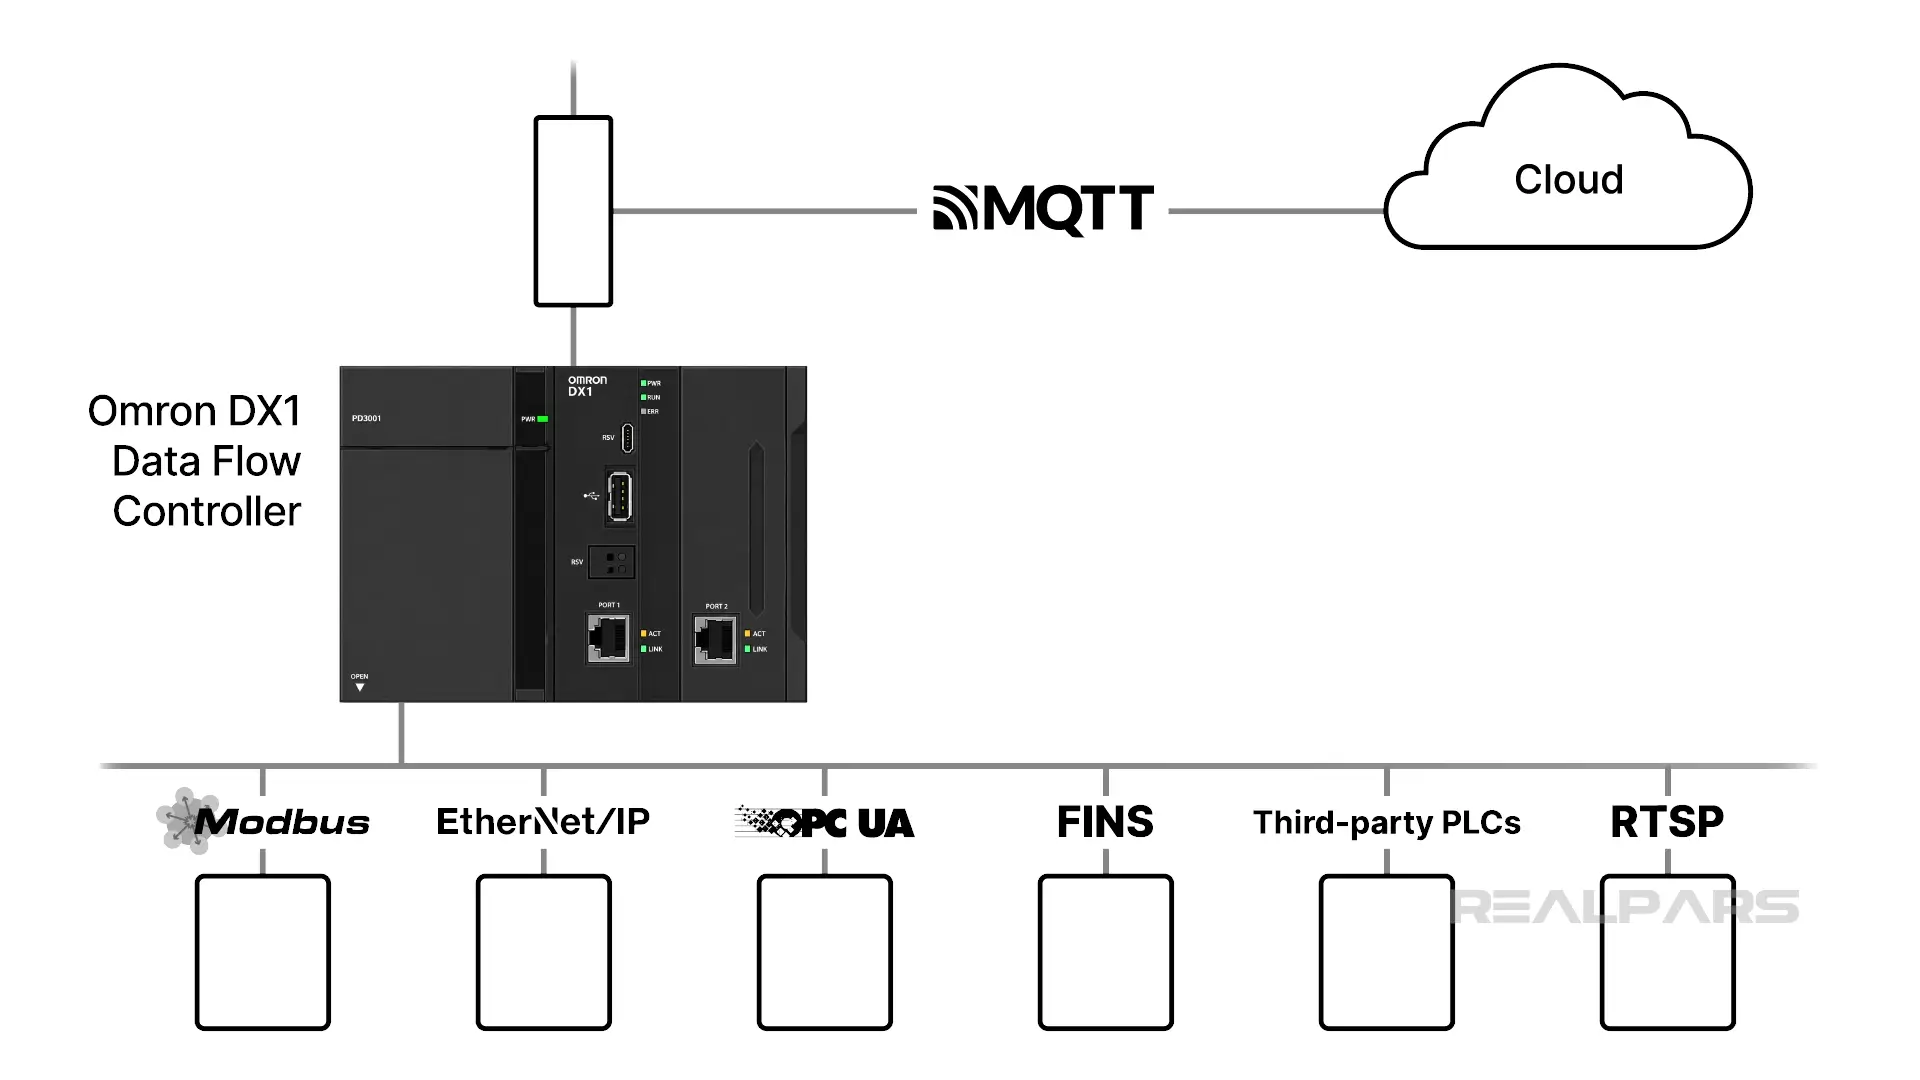
The DX1 is an edge controller capable of collecting and processing data from a variety of devices and protocols. As a standalone controller, it operates independently of your existing PLC systems and integrates easily with cloud platforms.
The DX1 supports multiple communication protocols for industrial automation and networking, including Modbus, EtherNet/IP, MQTT, OPC UA, FINS, third-party PLCs and RTSP for video streaming.
SpeeDBee Synapse
Ok, next we’ll have a look at the built-in SpeeDBee Synapse Engine.
Anyone with experience using Node-RED will recognize its graphical programming style in the Flow Editor. As in Node-RED, users can create their own custom modules using an open-source Python framework.
In the Flow Editor, users create data flows by connecting selected Components with lines.
There are five Component Categories. Users can add customized modules to these categories. We will use the Collector, Serializer, and Emitter categories in our demonstration.
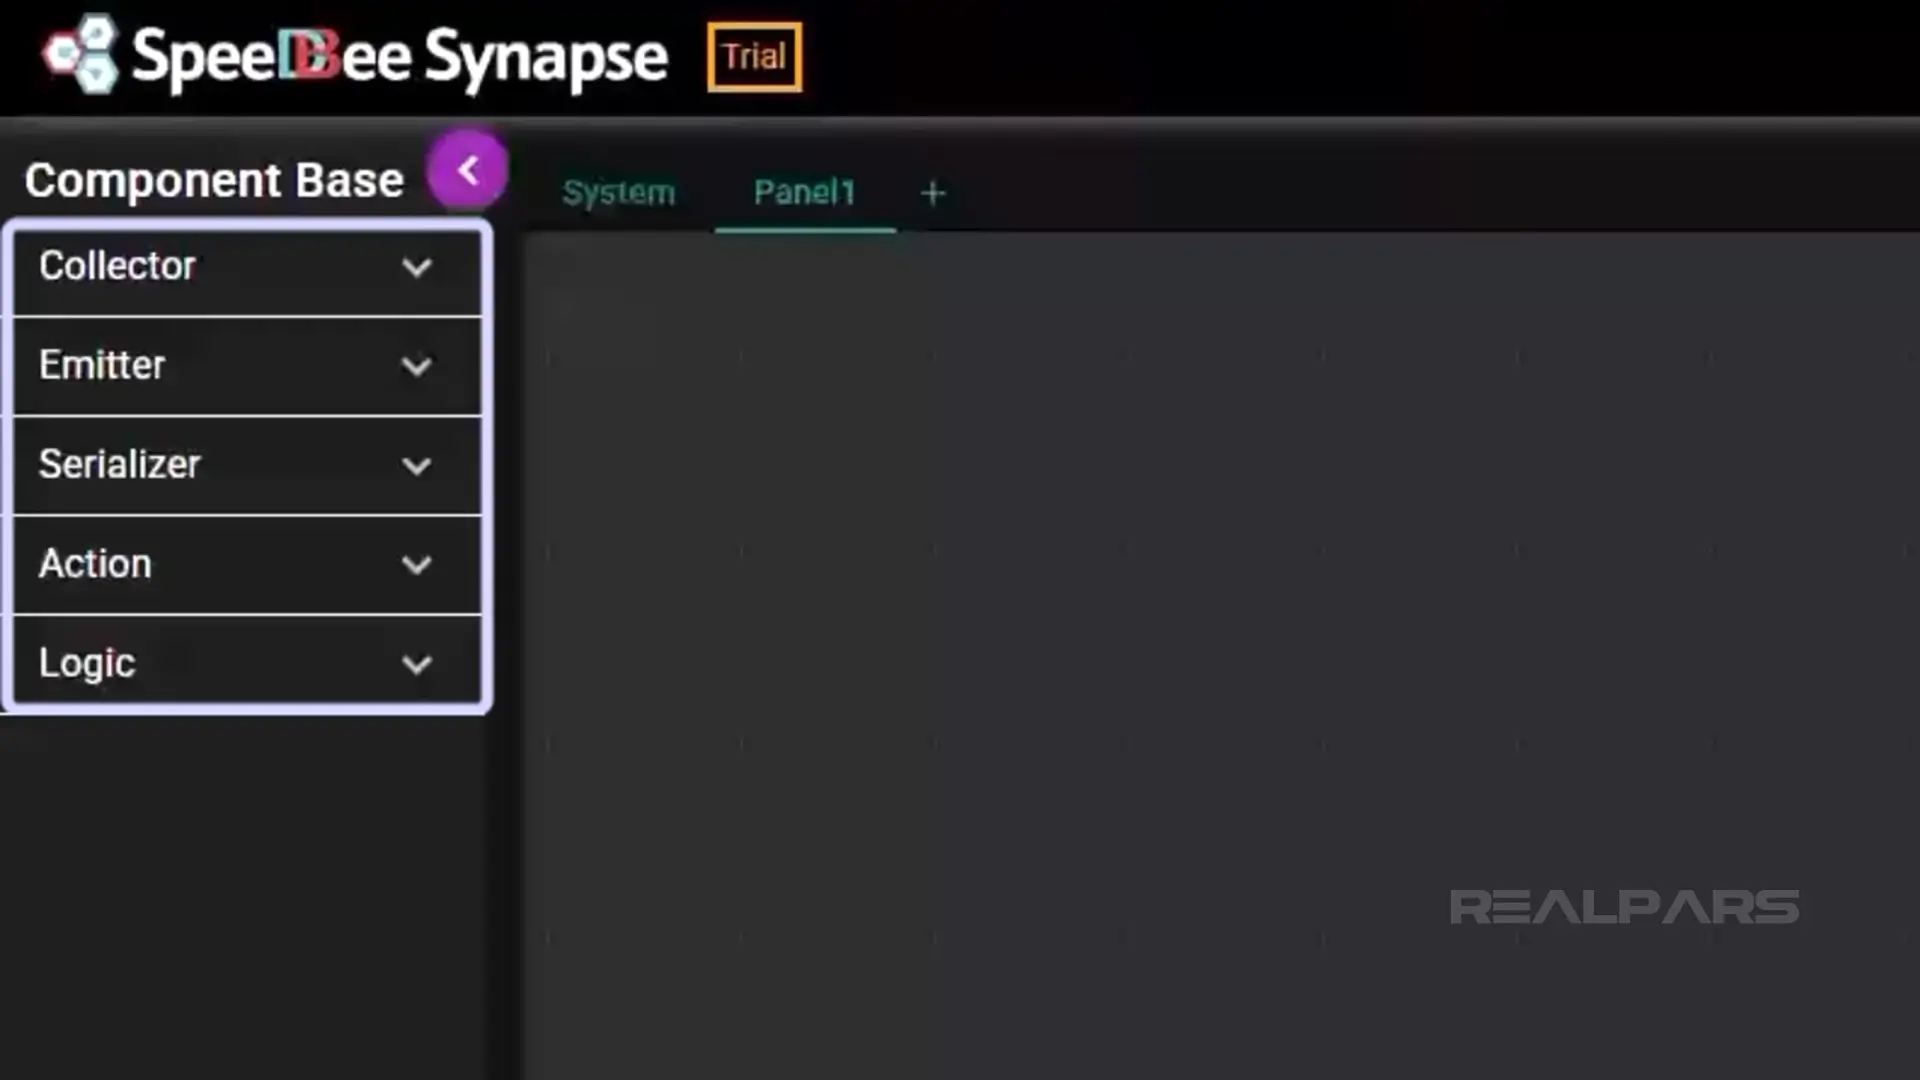
In a nutshell, Collectors perform the “Data In” functions, Serializers perform formatting, and Emitters perform the “Data Out” functions.
It’s as easy as selecting your component from a dropdown menu in your chosen category and dropping it onto the flow editor workspace.
Example
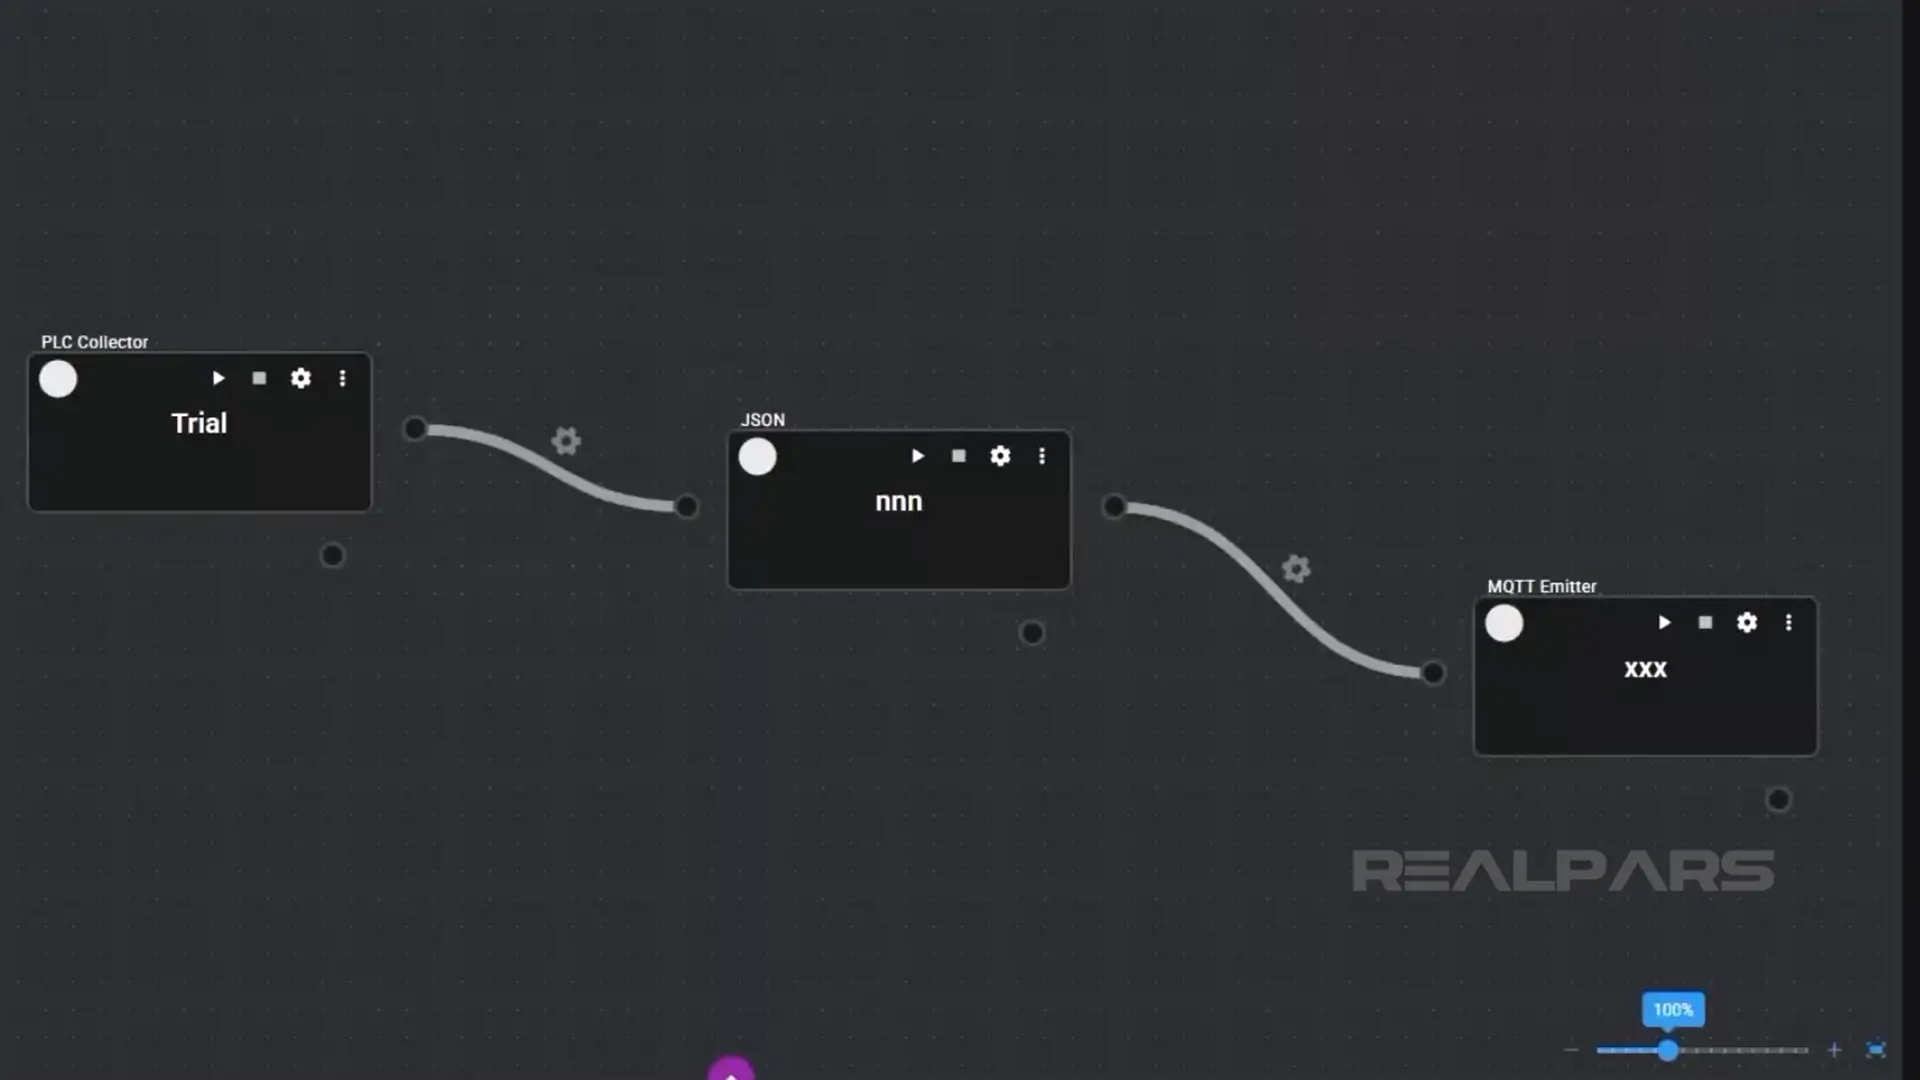
For example, we will select the PLC Collector component, drag it, and drop it into the workspace. After entering configuration details, the PLC Collector component appears on the flow editor. We’ll talk more about configuration later in the article.
Next, we’ll drag and drop a JSON Serializer component.
Now we’ll connect the two components.
Finally, we’ll drag and drop an MQTT Emitter component into our flow editor and complete the pipeline by connecting it to the JSON component.
That’s it! You are looking at the collector, serializer and emitter connected together as a pipeline.
OK, let’s get into the fun stuff.
In our project, we are using the DX1 controller to collect data from three devices.
- Voltage and current data are collected from the S8VK Smart Power Supply via ModbusTCP
- Motor torque and thermal data are collected from the NX102 PLC via OPC UA
- Motor temperature and Vibration are collected from the K6CM-VB motor condition monitoring device
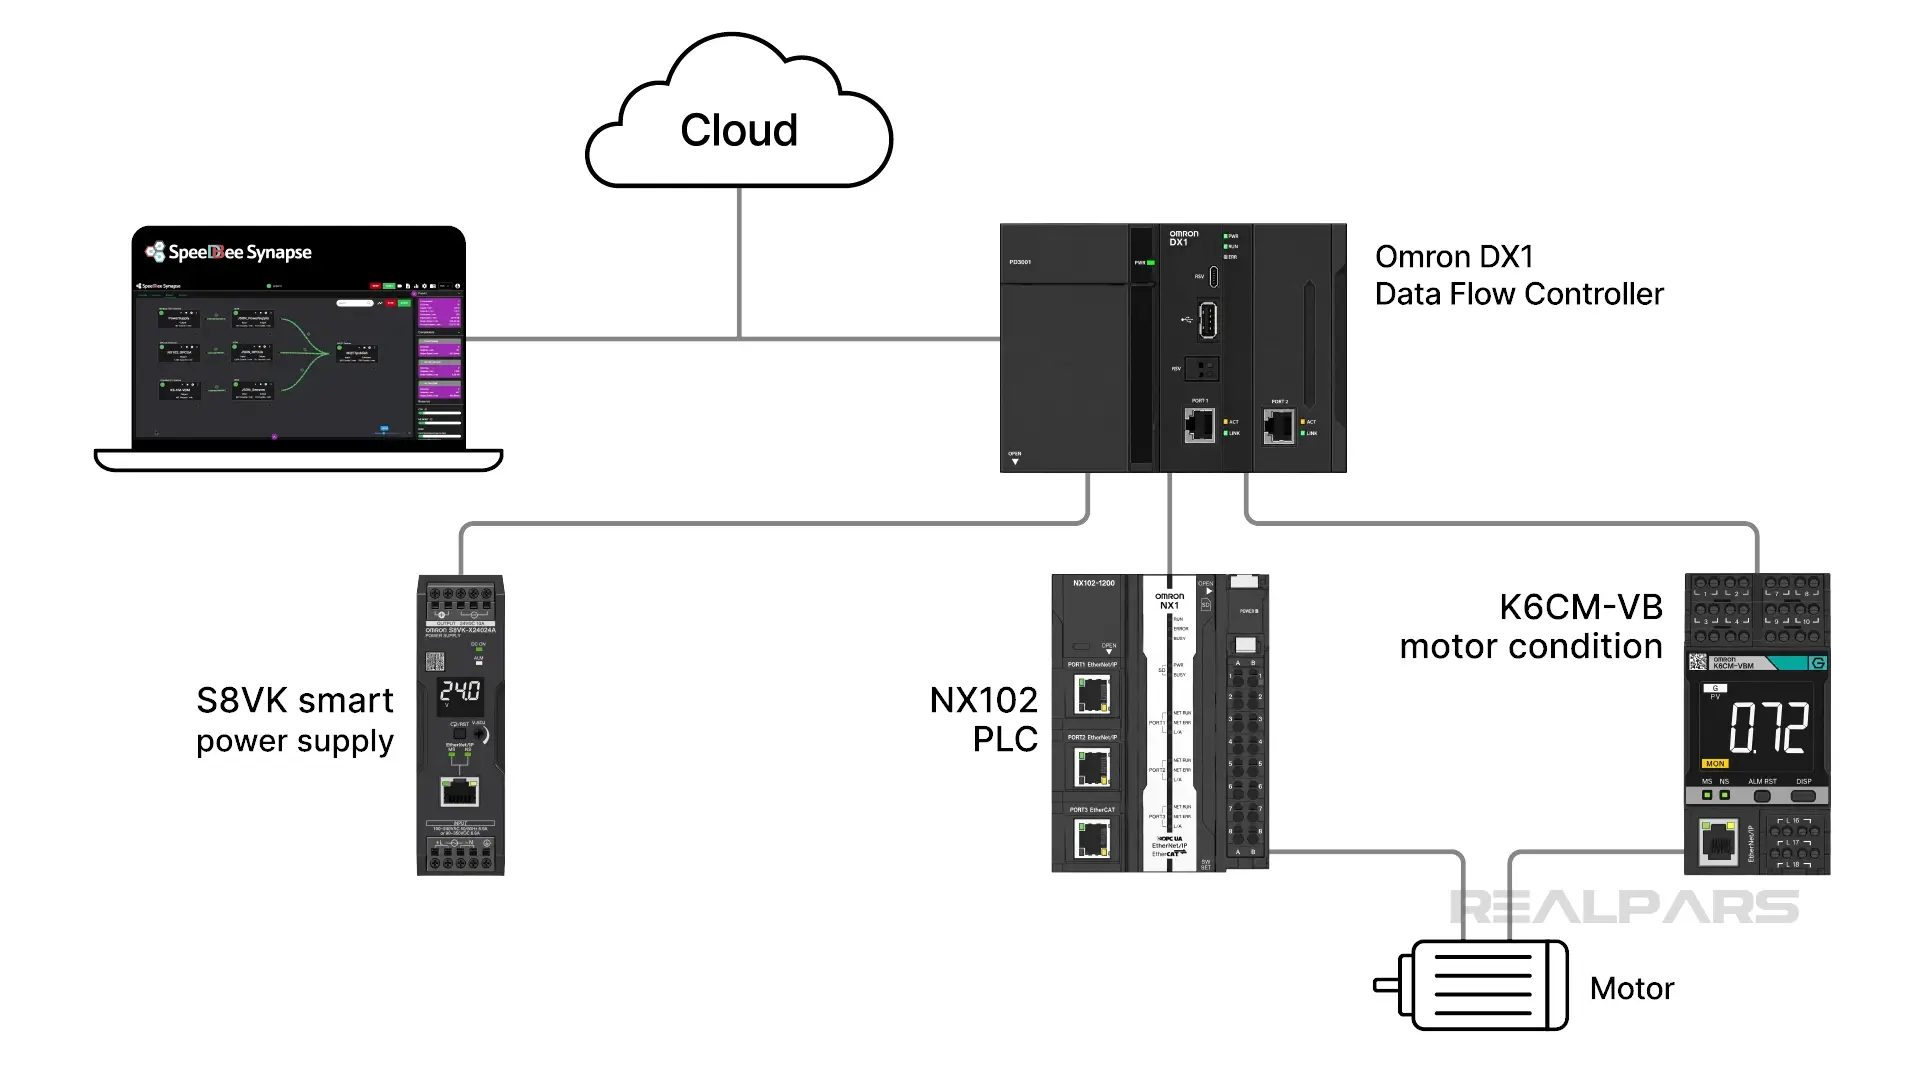
Once collected, we will serialize the data into JSON and transmit it via an MQTT Broker to any Subscribers.
And while we’re at it, we will integrate with Grafana so we can see our data in real time.
DX1 Web UI
We’re going to study an already-built system. To begin, we log into the DX1 Web UI.
Once we’re in, the Application Manager will lead us to SpeeDBee and Grafana.
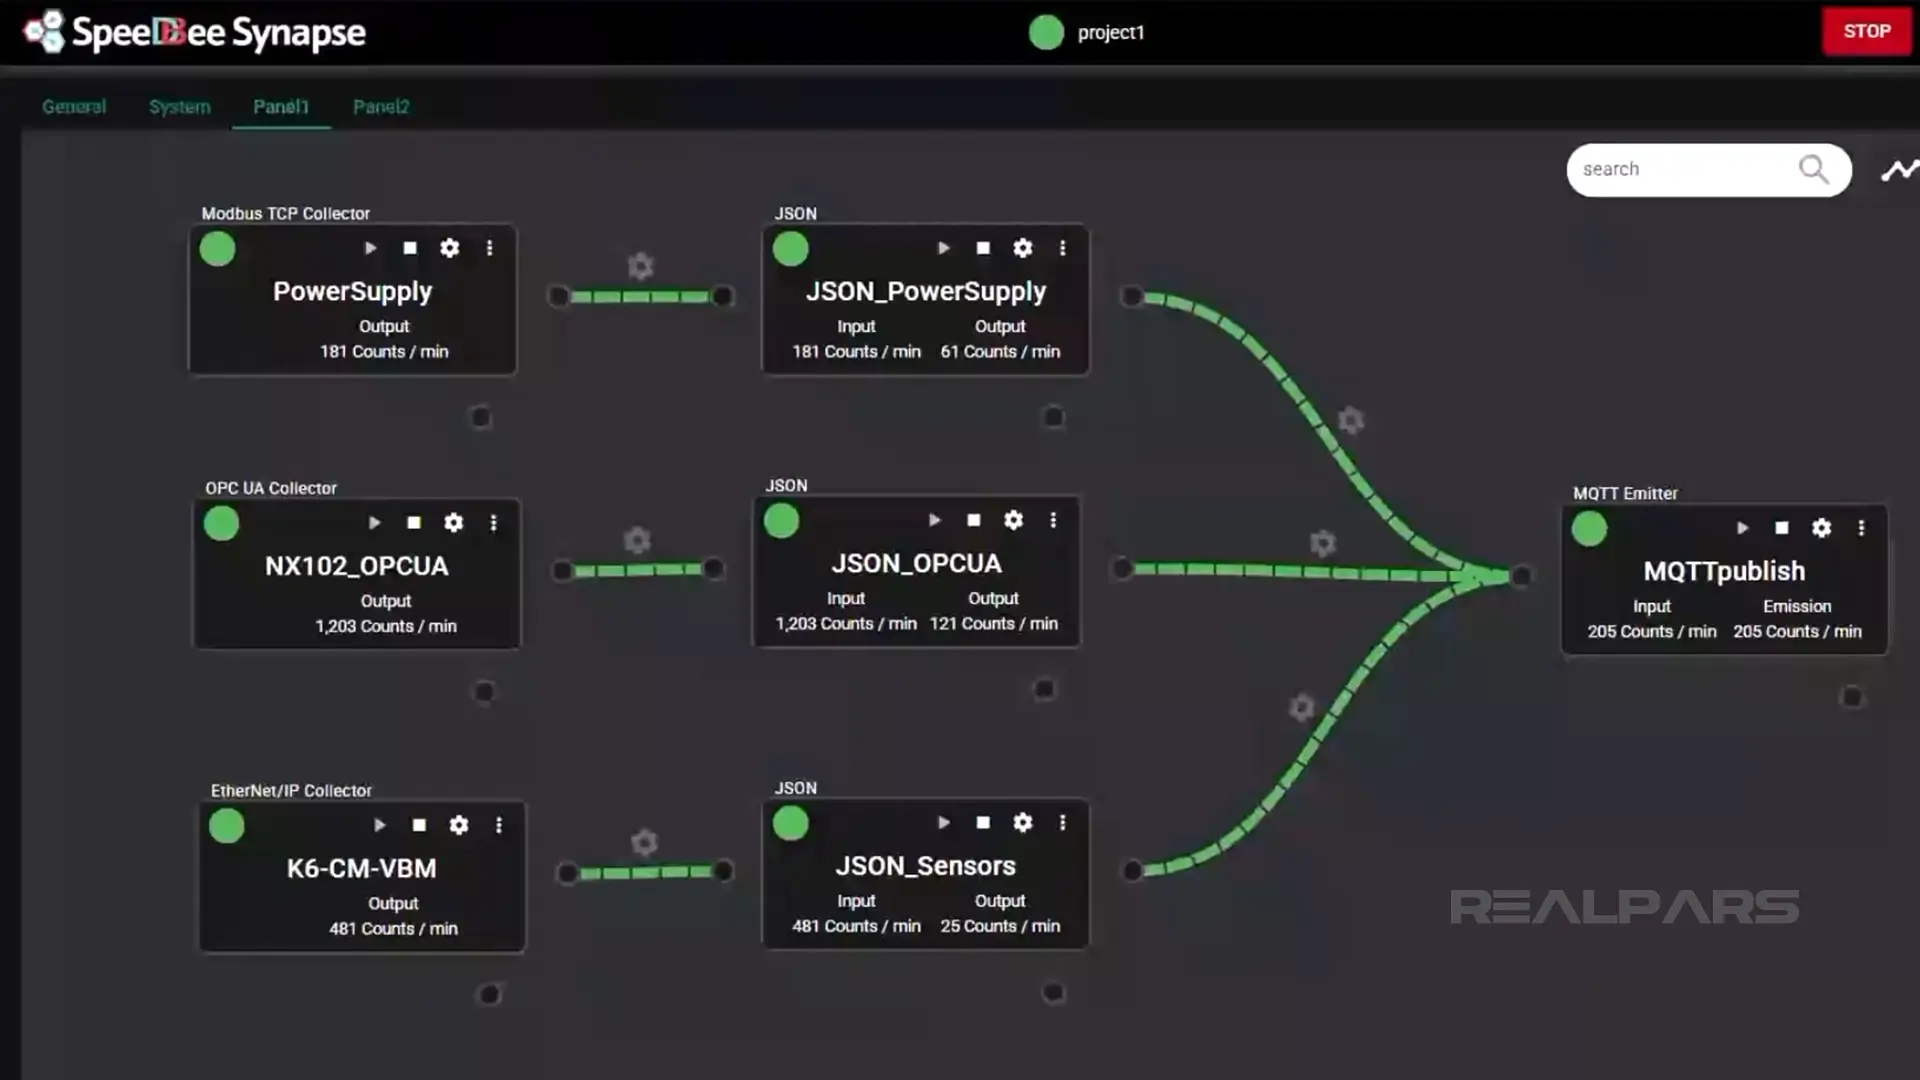
We’ll connect to SpeeDBee first, and then click on Panel1 details to view our constructed pipeline.
Now we’ll connect to Grafana from the Application Manager.
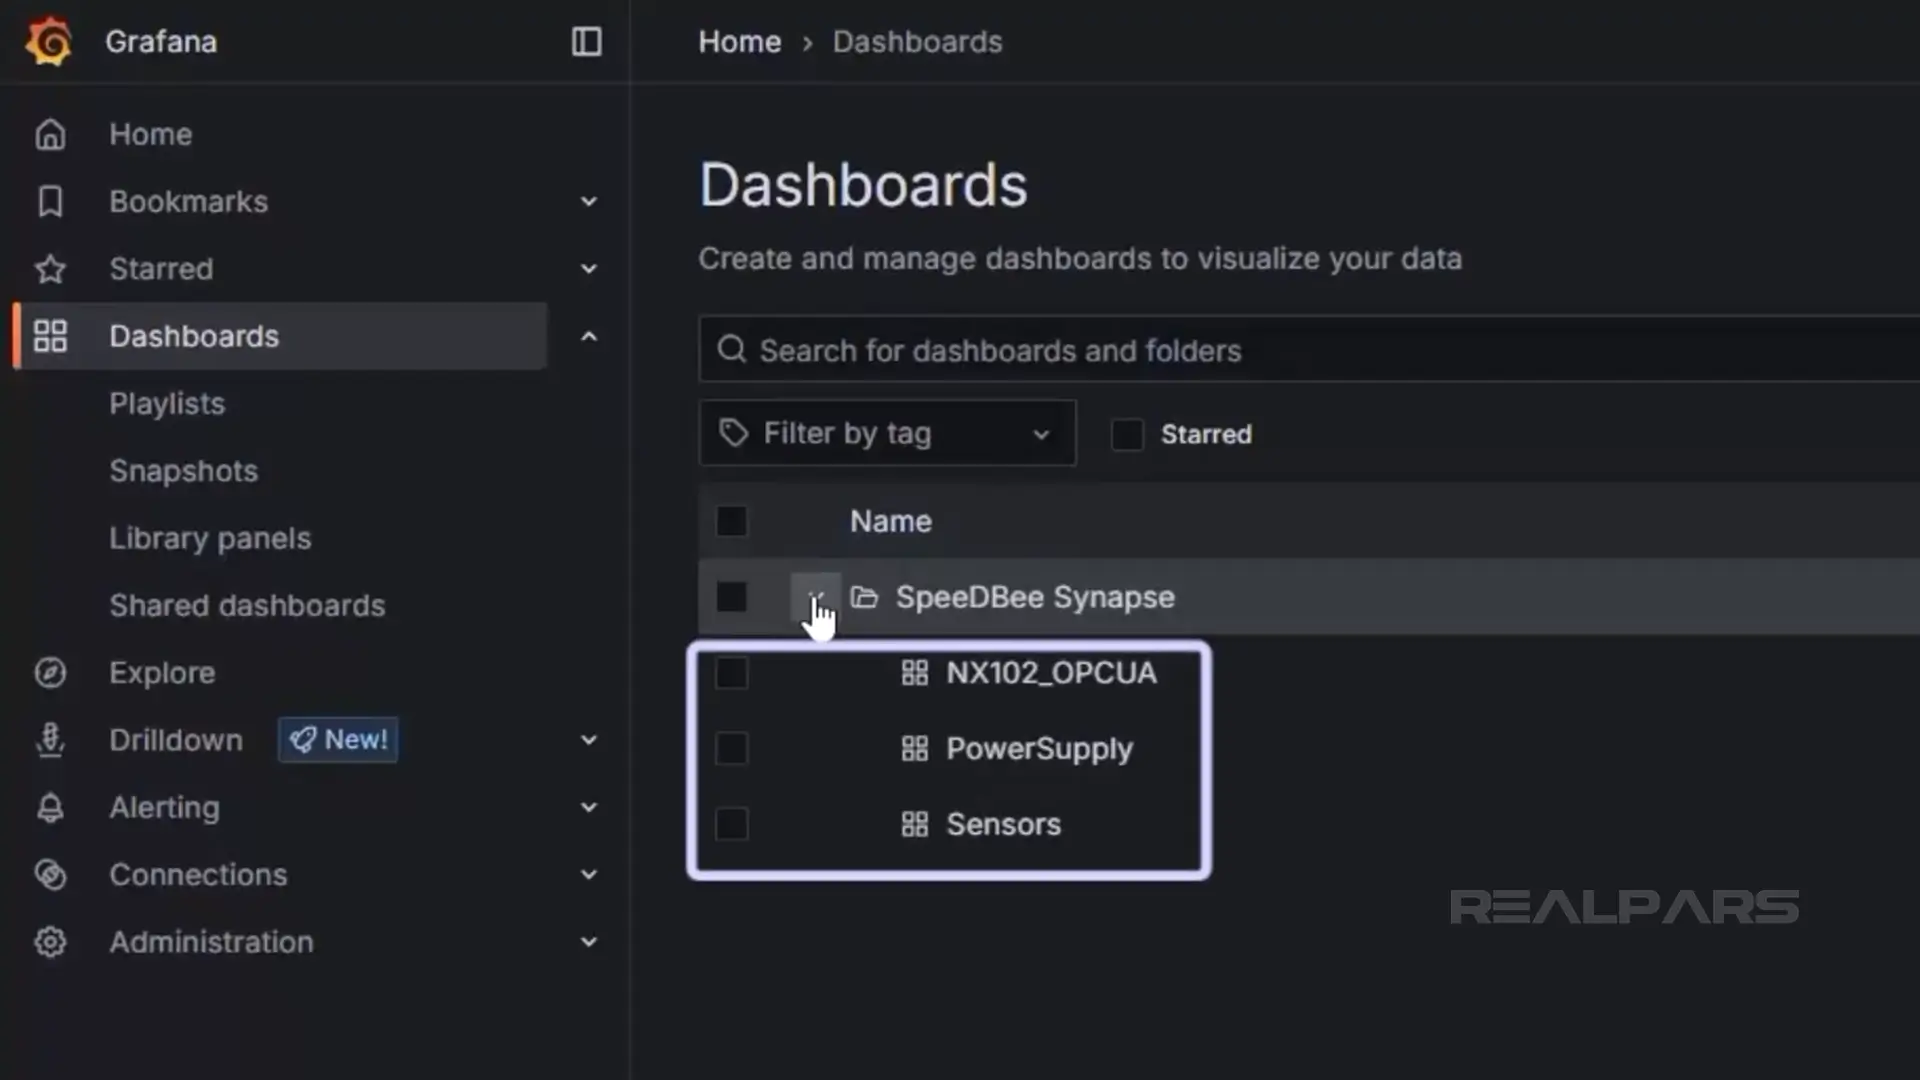
Clicking the Dashboard icon opens the 3 dashboards that display our collected data.
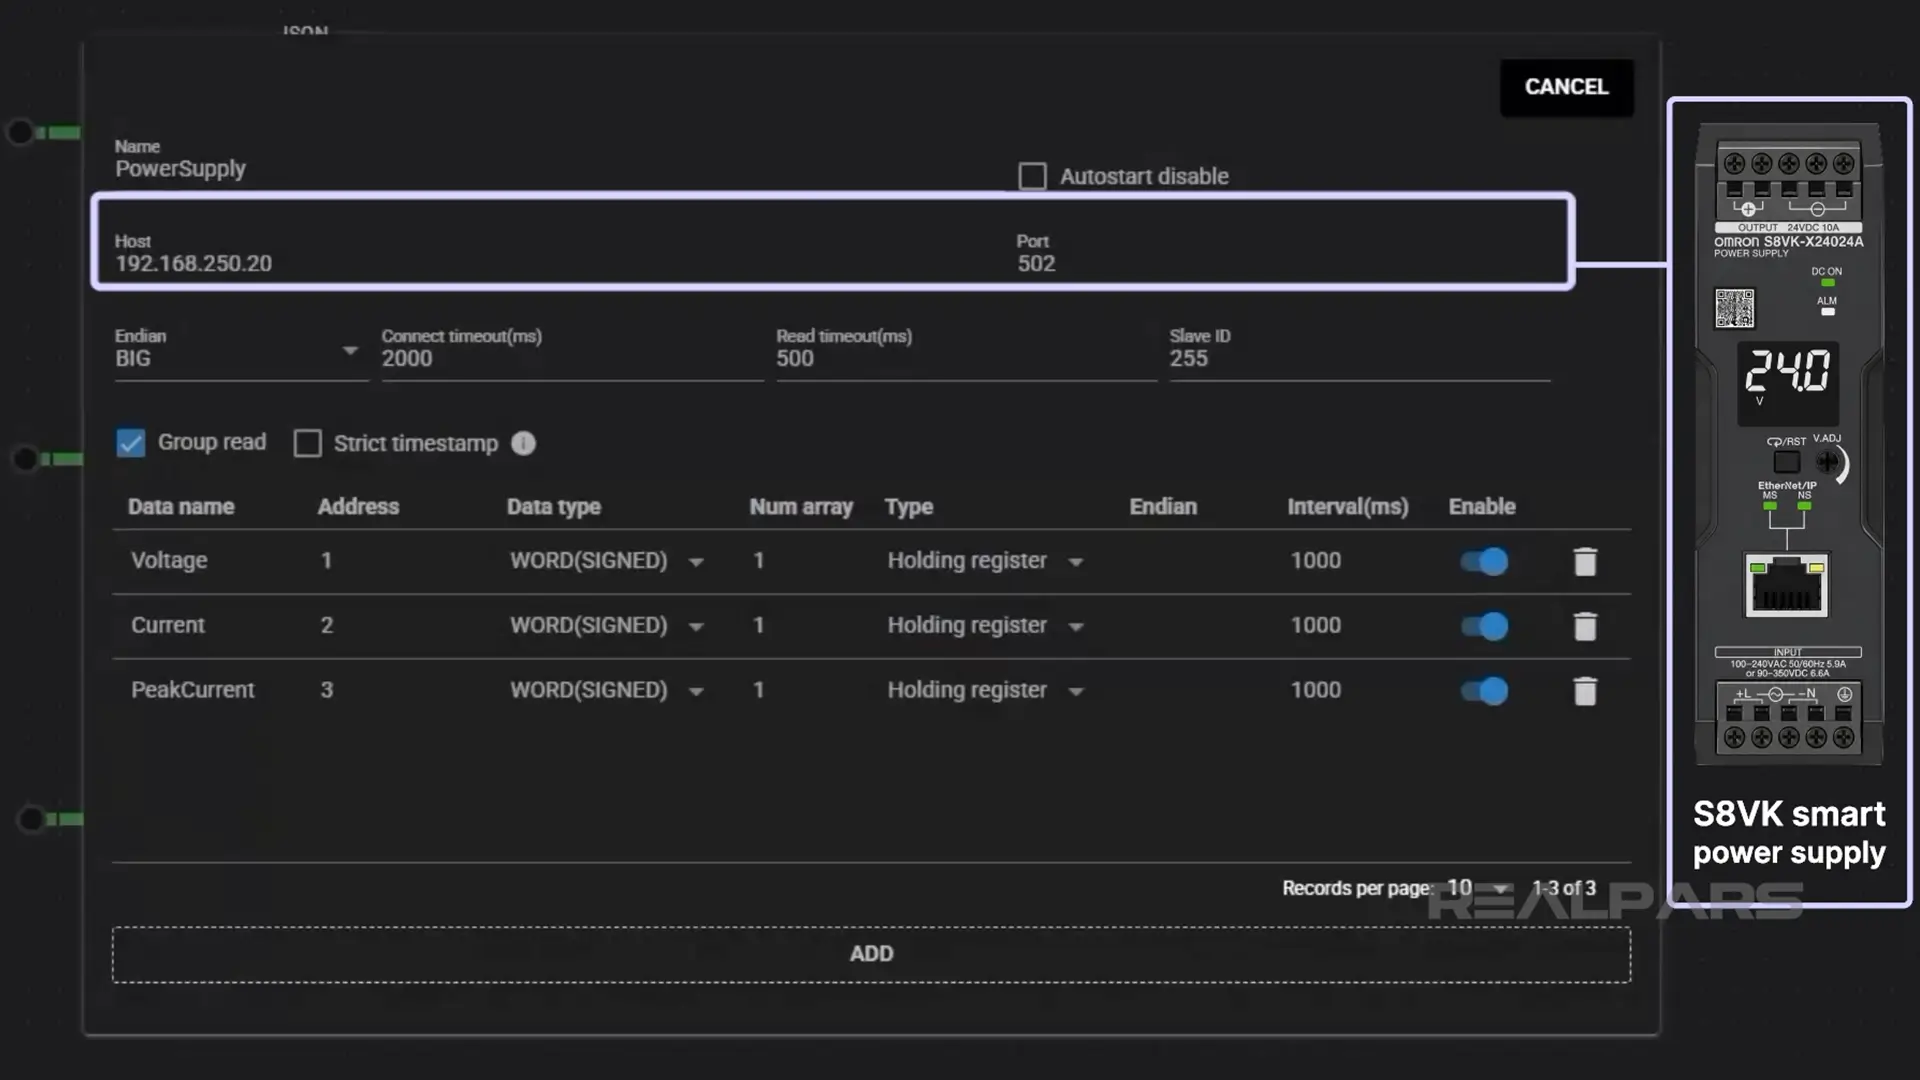
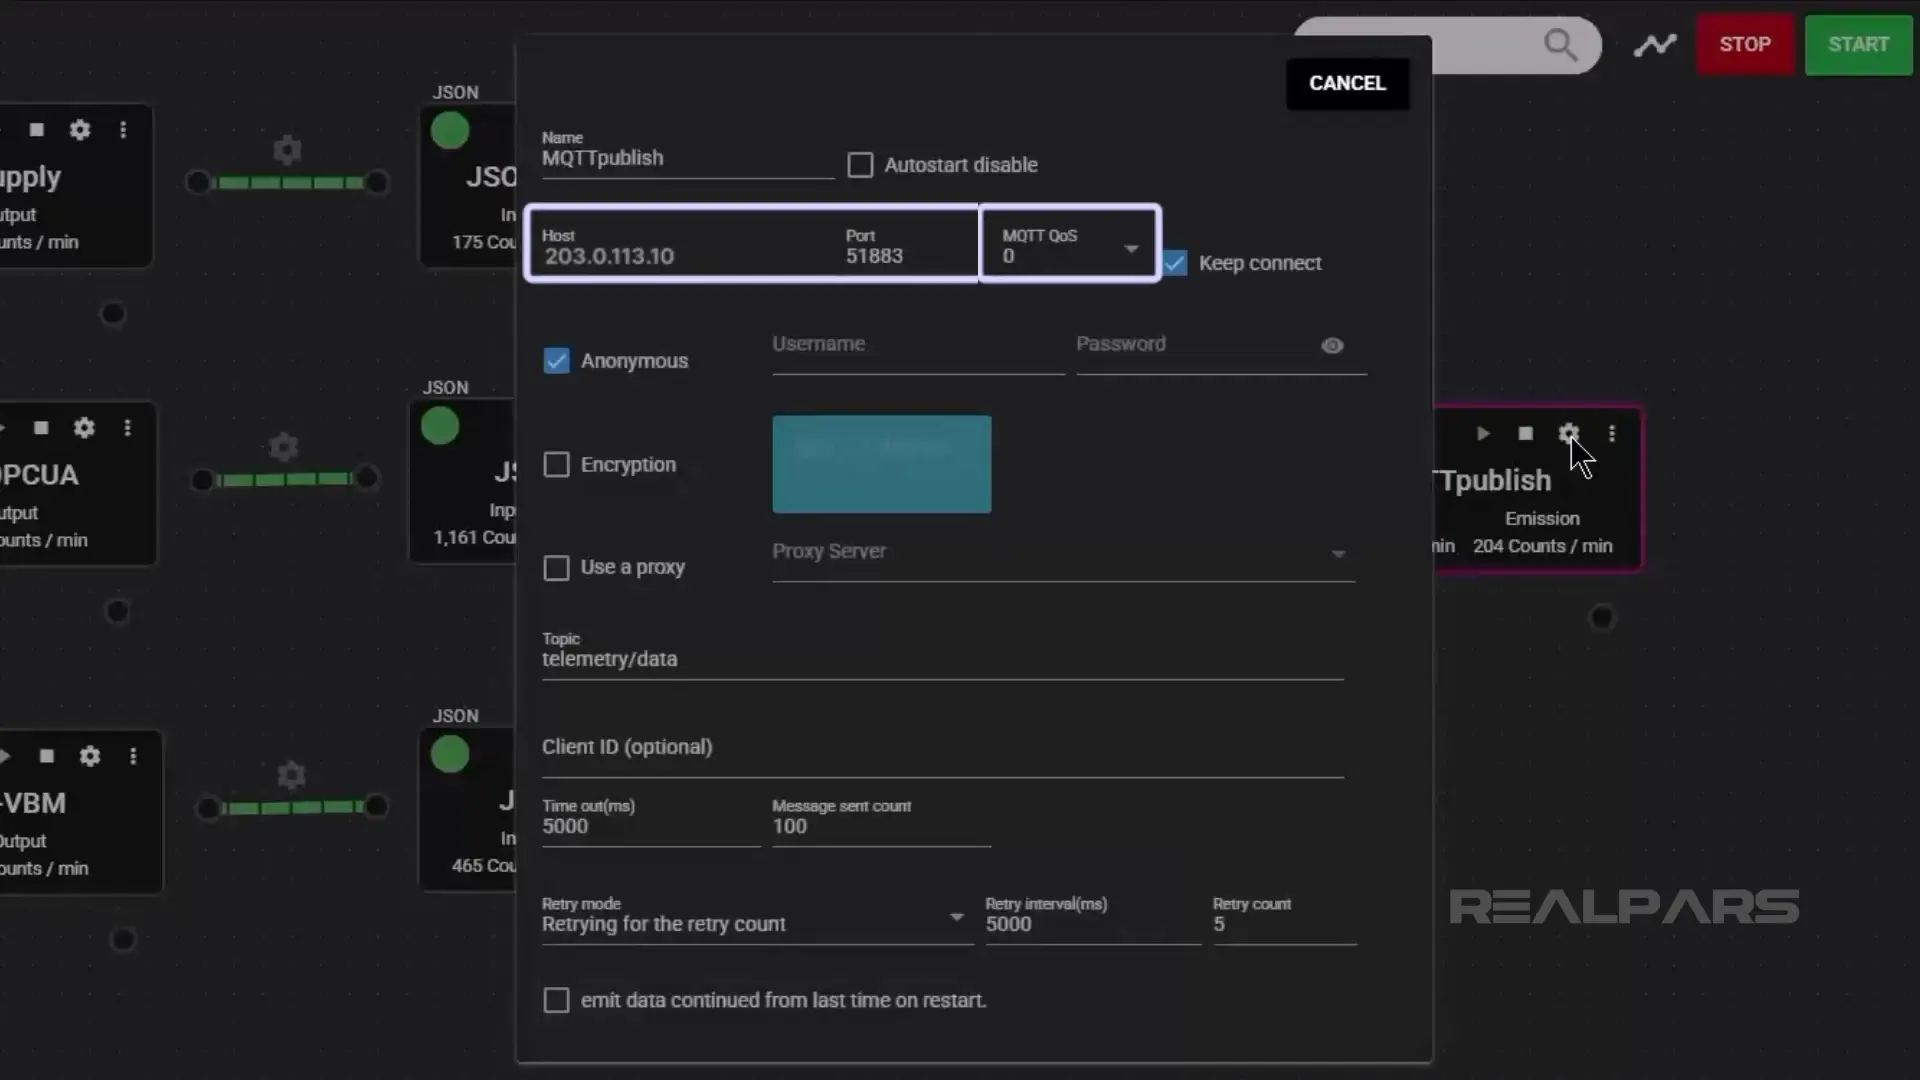
Ok… back in SpeeDBee, we’ll open the configuration window to review the Modbus TCP Collector settings.
We can see the Address of the Host, which is the S8VK-X power supply.
We can repeat the process for each collector component.
Keep in mind that all collector configuration data is entered at pipeline creation.
We continue with the JSON serializer components and finally the MQTT emitter component.
Here we can see the Broker Host details and the QoS level, along with other settings.
Notice that we are in Run Mode.
Configuration changes can be made easily by going to Edit Mode.
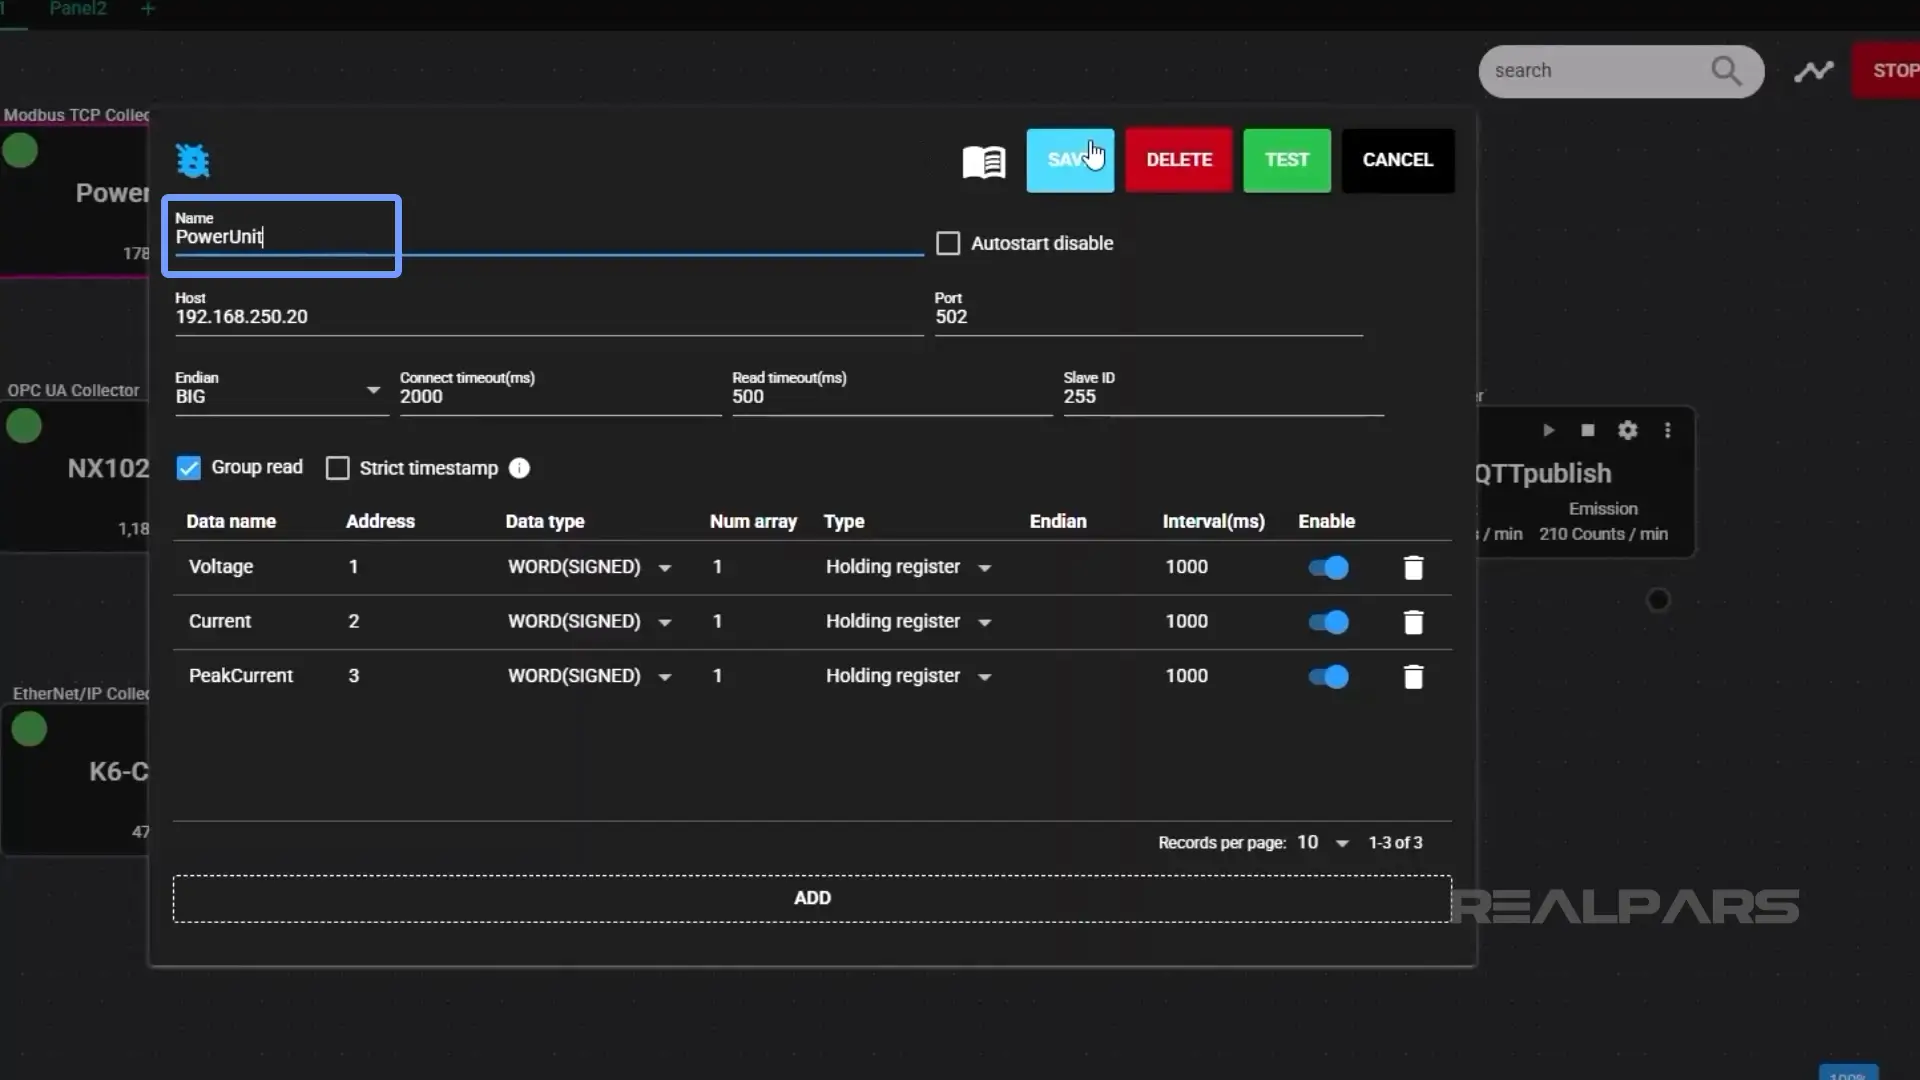
Let’s change the name of the PowerSupply collector component to PowerUnit.
First, we change from Run to Edit mode. Next, we open the PowerSupply collector configuration.
We enter the new name PowerUnit, then choose Save.
Back we go to Run mode. Note the new name and the blue button.
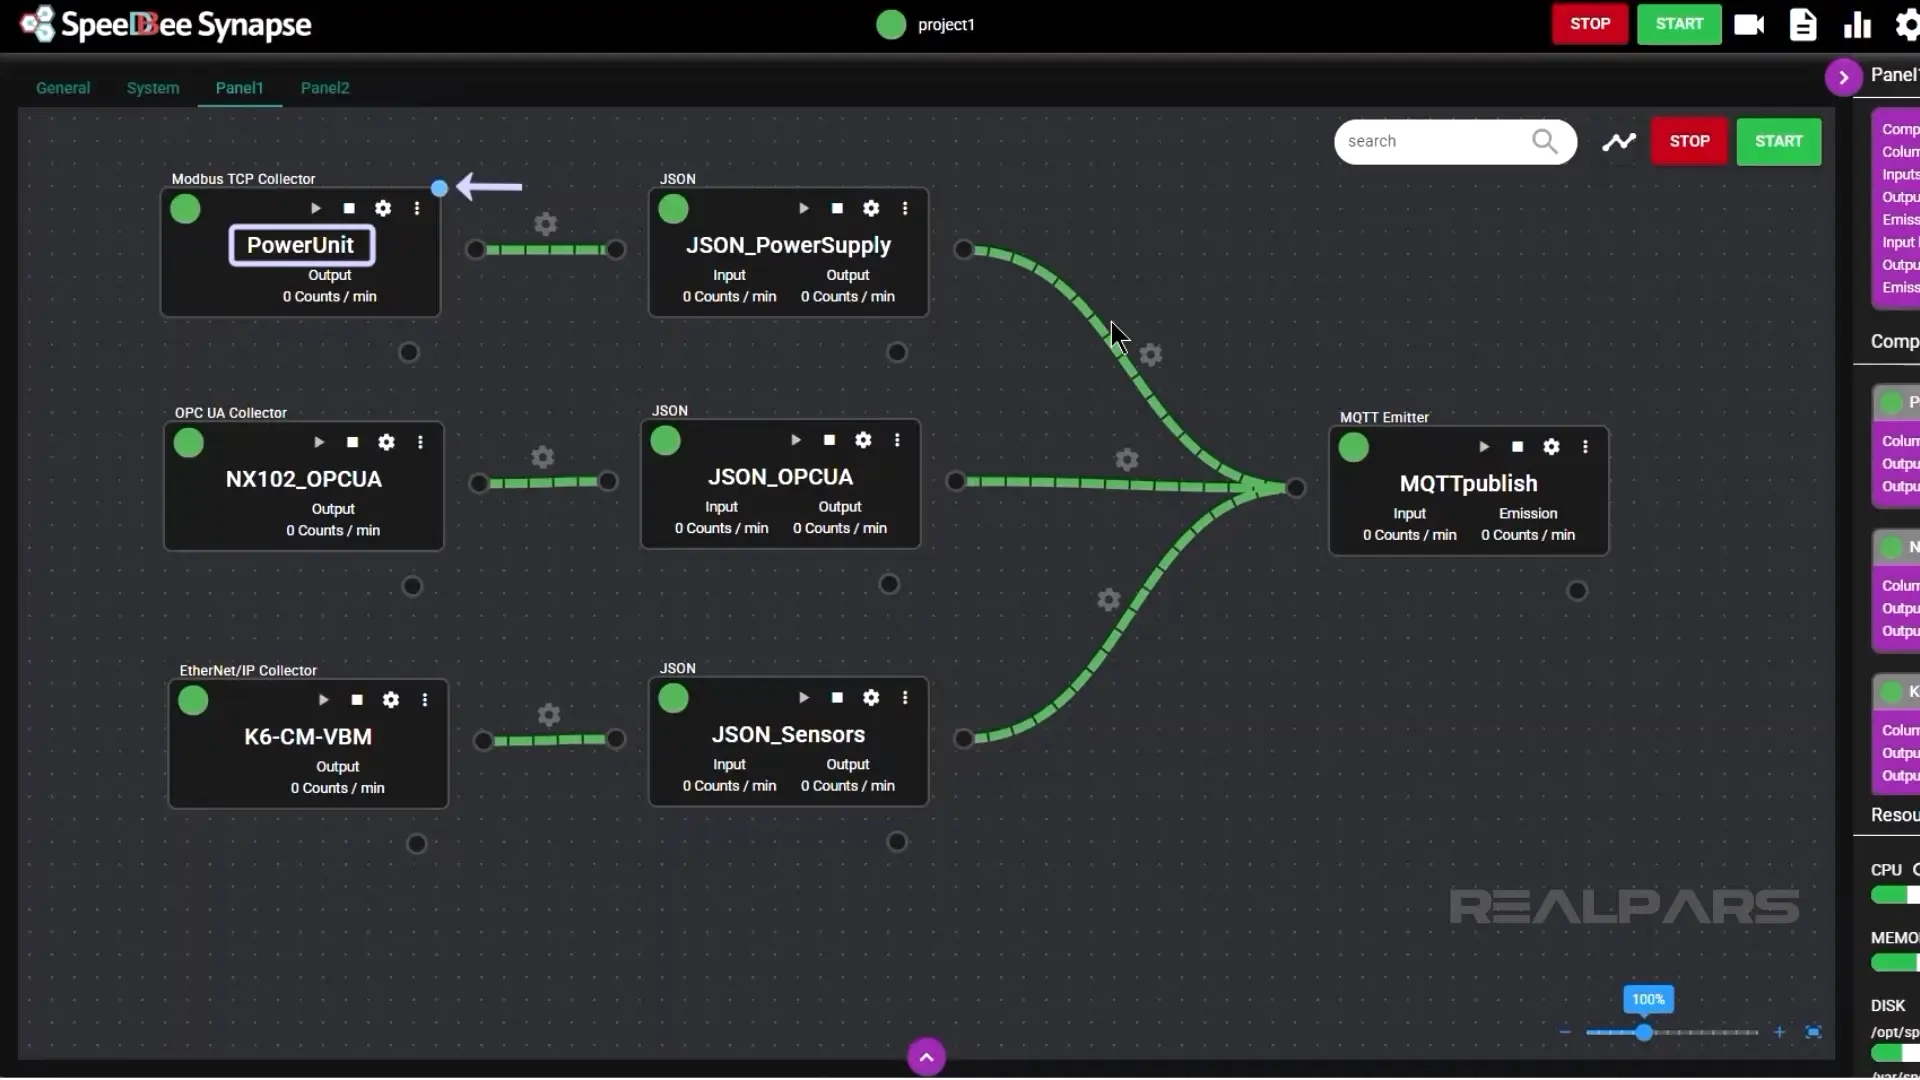
We need to click on Start to activate the new edit. This is similar to Deploy in Node-RED.
Let’s look at another interesting option while we are here.
We’ll click on the purple arrow at the bottom of the screen and select “Latest” from the dropdown menu choices on the left hand side.
Clicking on the PowerUnit component output opens a display of the latest current and voltage values.
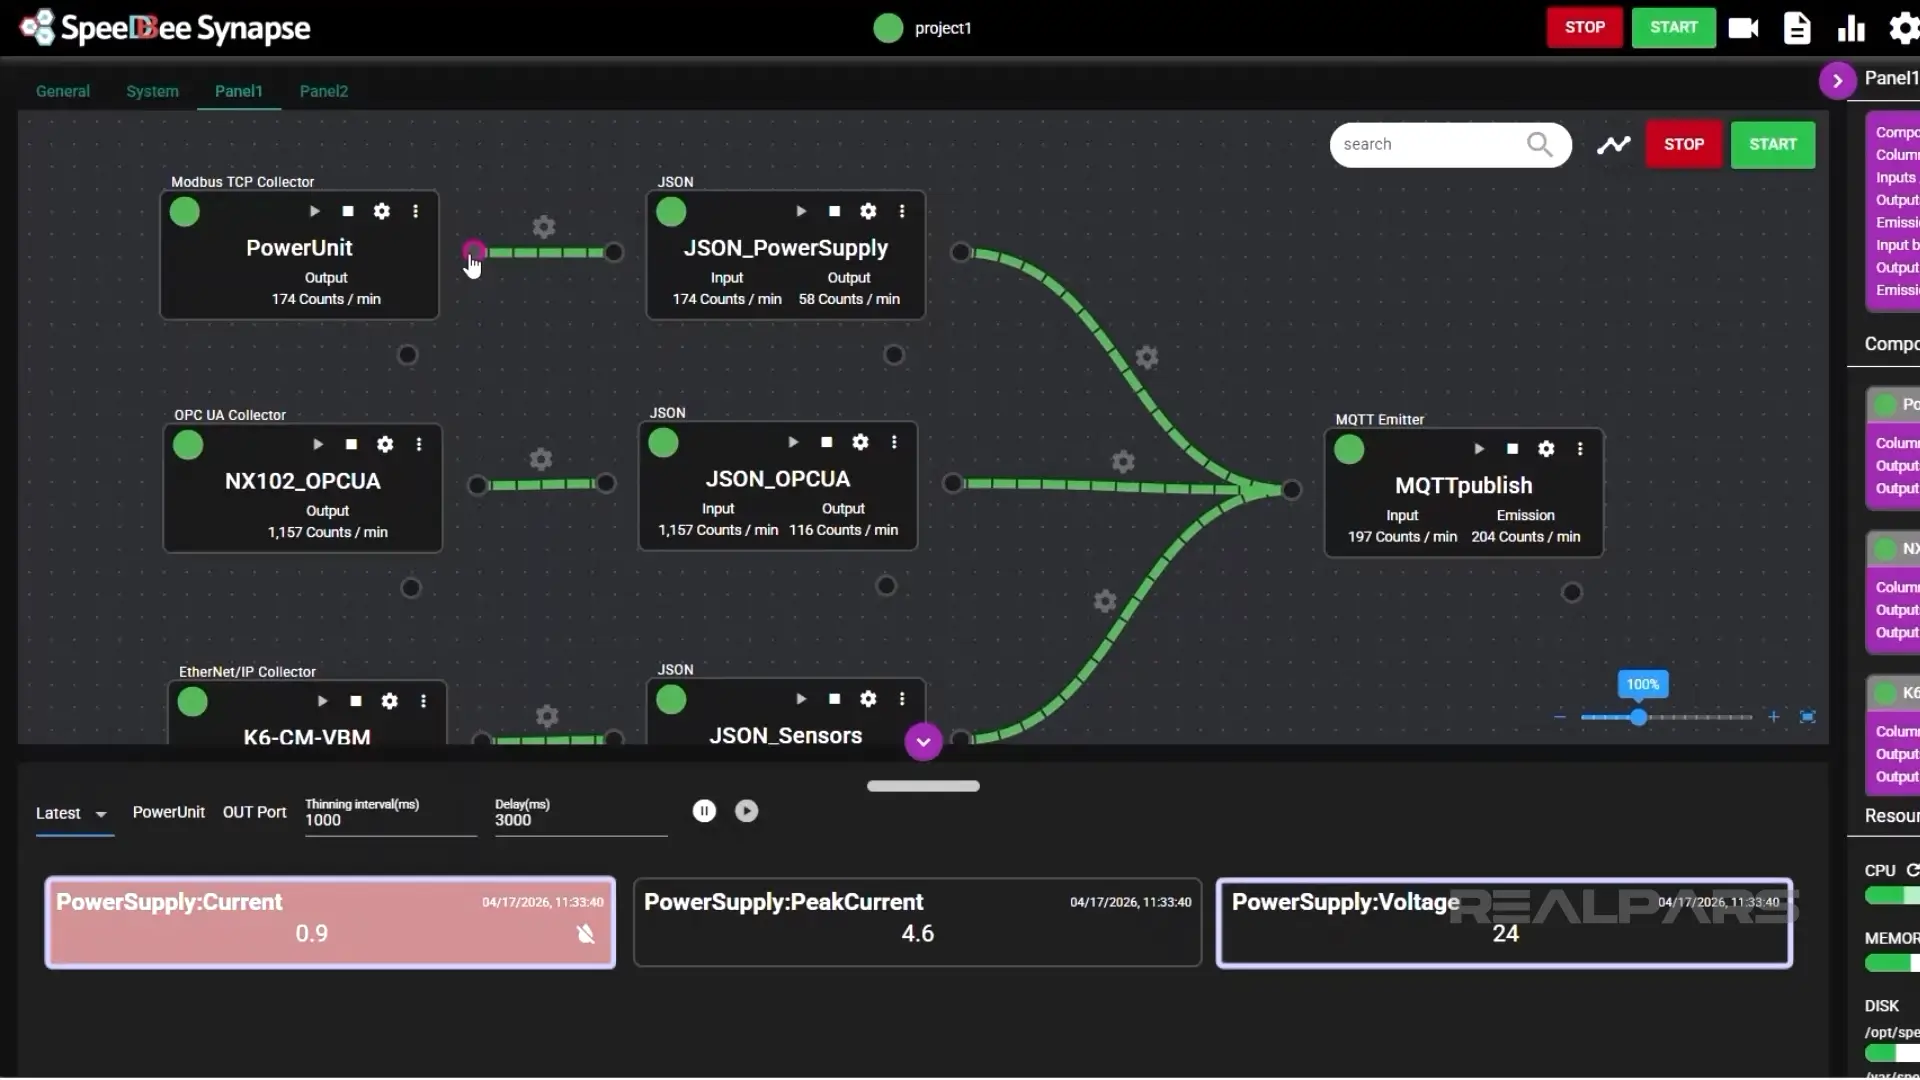
Any component's input or output can be viewed simply by clicking it.
Grafana
Let’s finish this demonstration with a look at the Grafana interface.
Once we’re connected to Grafana, we’ll see three Dashboards listed under SpeeDBee Synapse.
Let’s look at each dashboard individually.
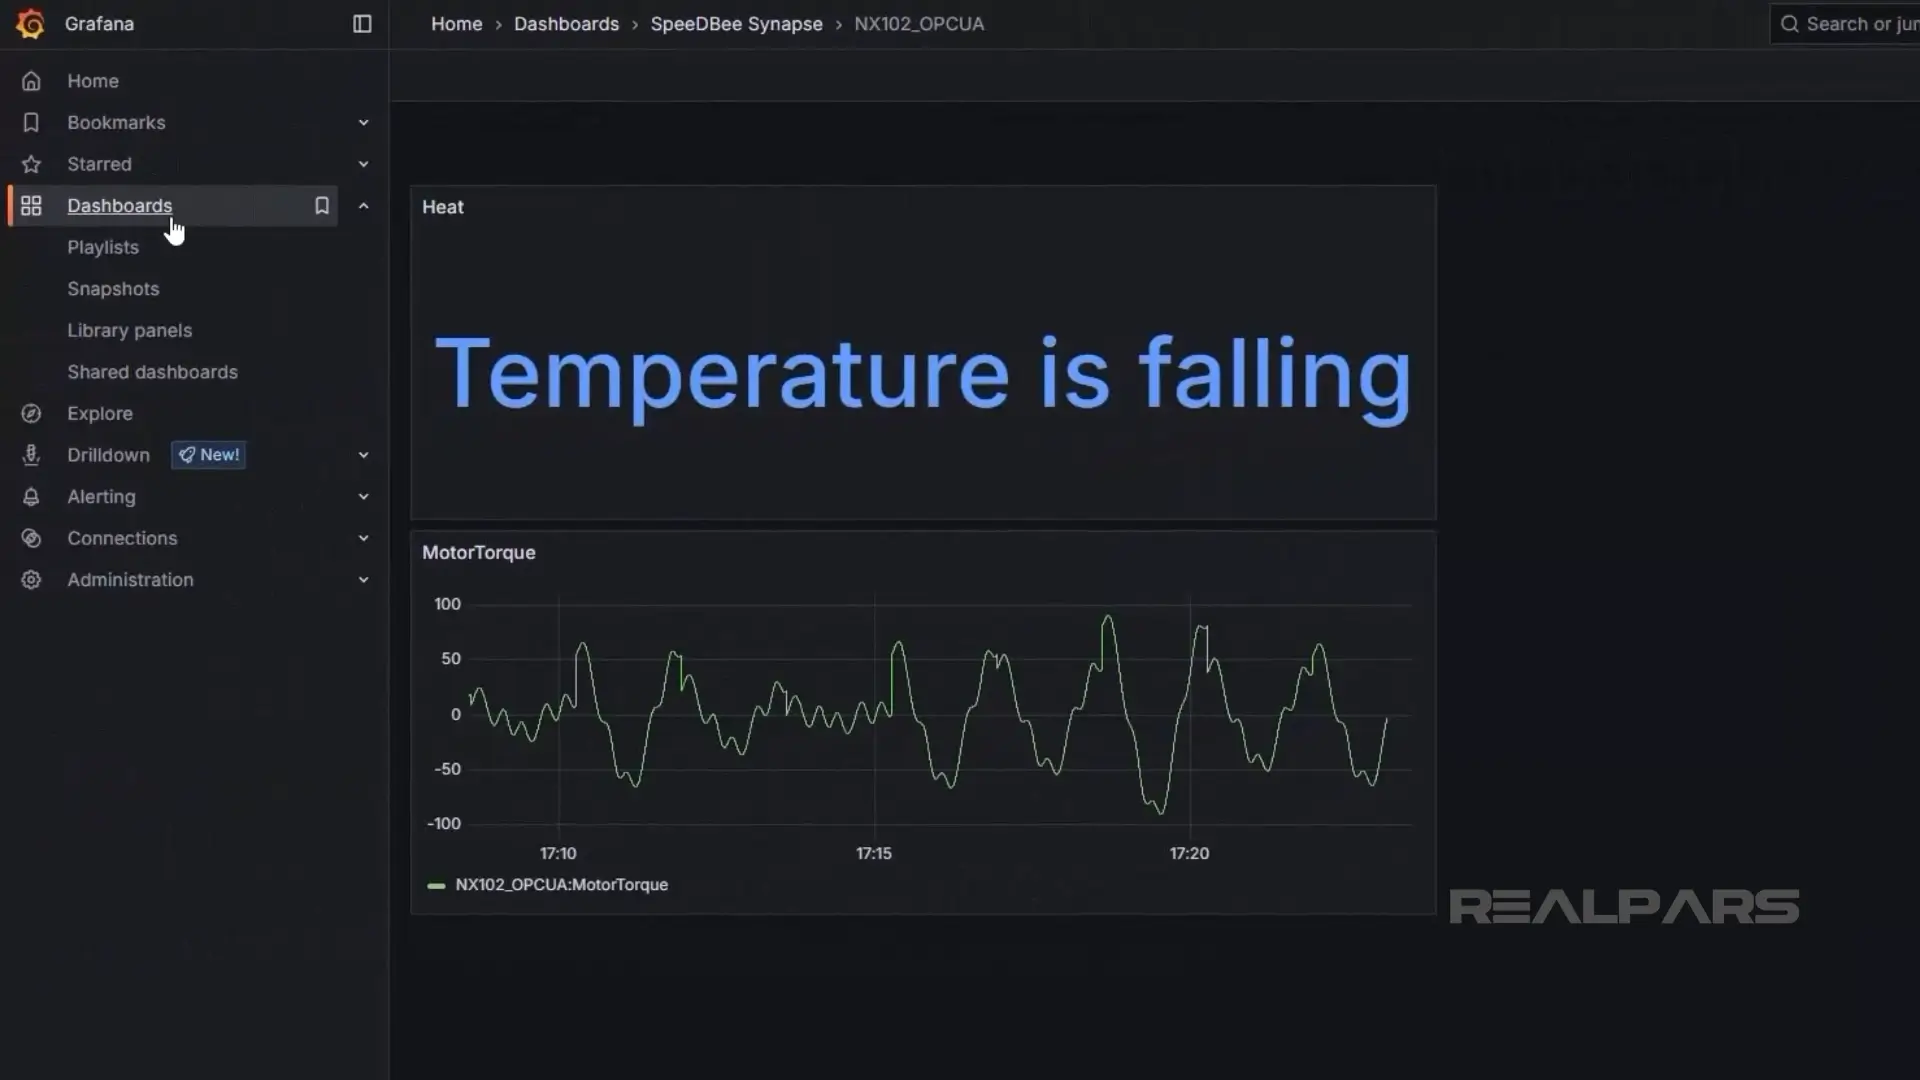
First, we’ll check out the NX102 PLC OPC UA data, which is the Motor Torque and temperature status. We’ll change the Refresh time to get faster updates.
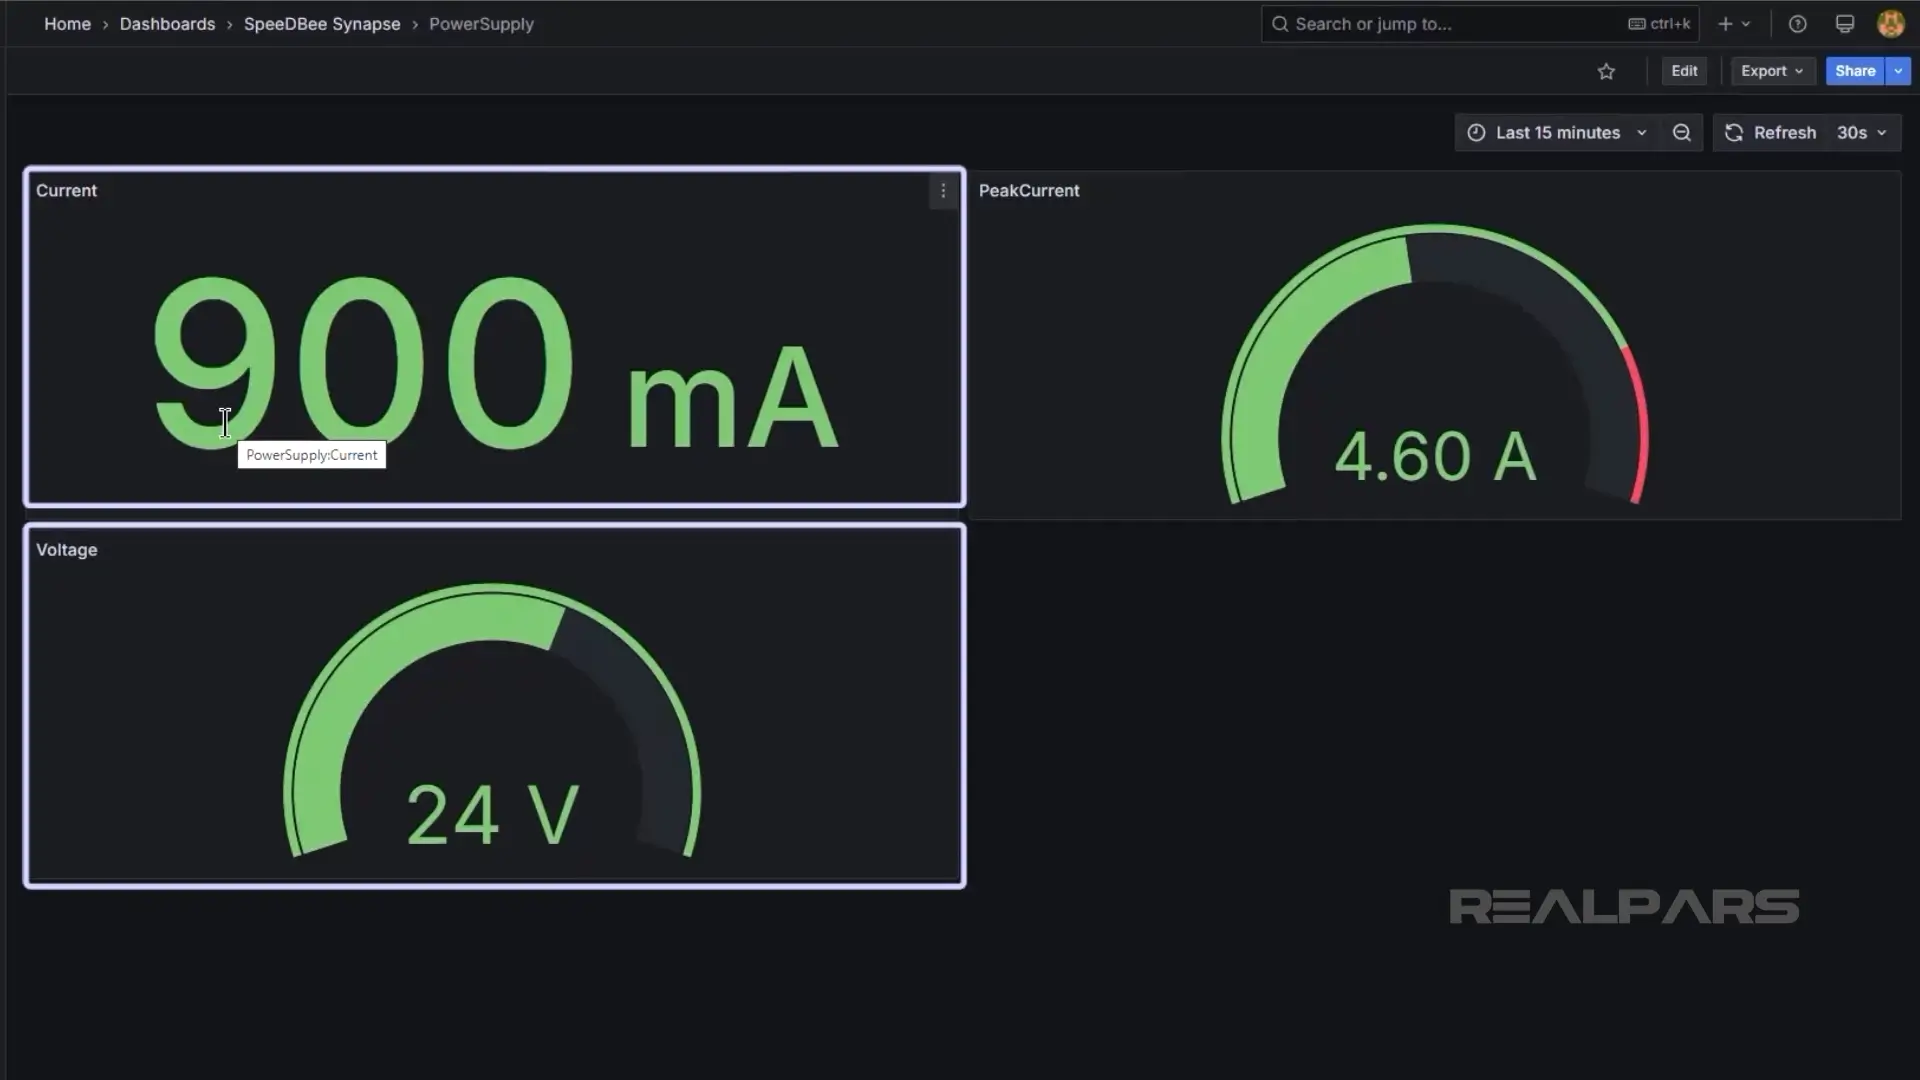
Next, we’ll have a look at the Power Supply Modbus TCP Dashboard.
This gives us current and voltage data.
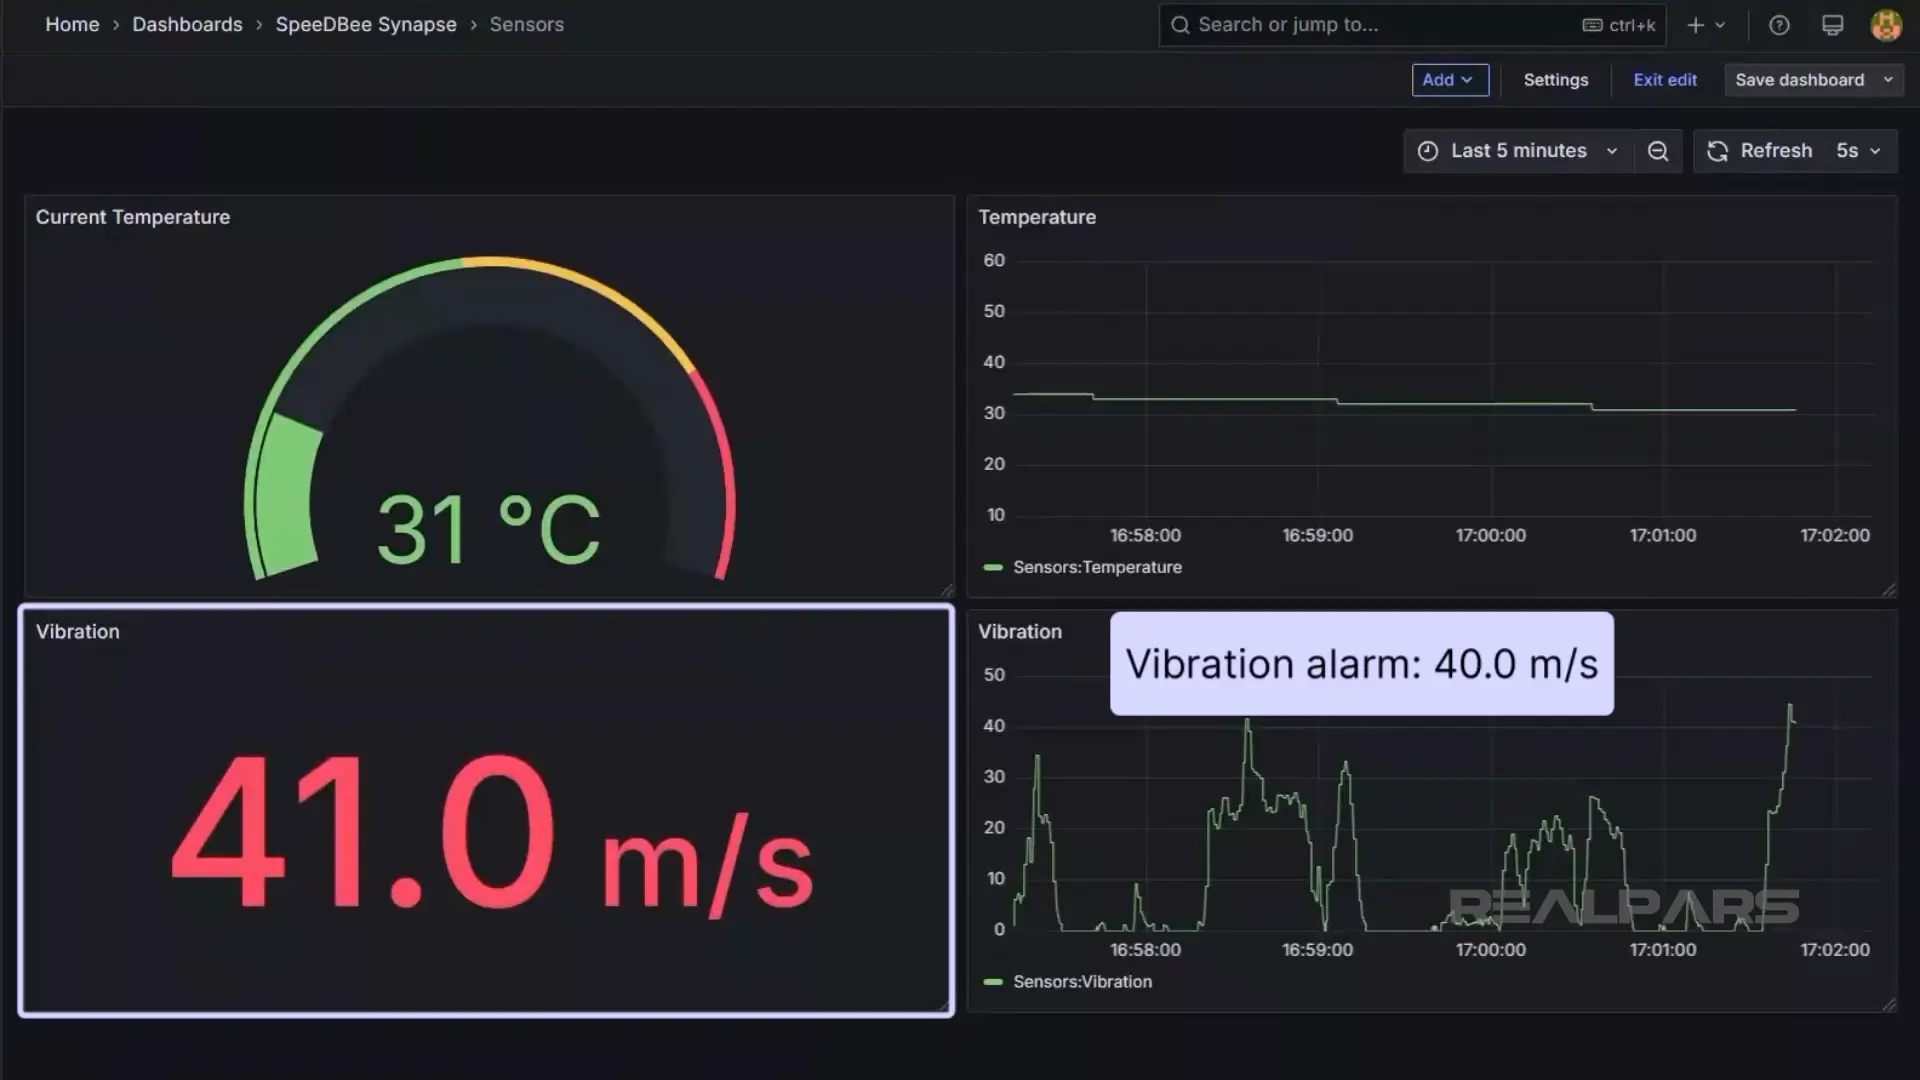
Finally, we’ll review the sensor data from the Condition Monitoring Device Ethernet/IP Dashboard, which provides motor temperature and vibration data.
We have captured some vibration data showing both normal and alarm conditions. We’ve set the vibration alarm to 40.0 m/s, and anything over that will be shown in RED.
Wrap-Up
Okay, let’s wrap it up.
You don’t need to be an IT programming wizard to use the built-in SpeeDBee Synapse engine.
Whether the DX1 is collecting data from PLCs or other devices, the workflow remains the same.
Using the three core components, Collectors, Serializers, and Emitters, you can quickly build secure data pipelines to the cloud without modifying existing control programs. It is a standalone, enterprise-ready solution that helps you start using your factory data in minutes.